Rational Functions
Contents
1. Motive
The main goal of this research is to develop a method to fit smooth functions onto data. For this project, the data of colormaps and 2D shapes were used.

2. Rational Polynomials vs Rational Functions
Very often, people would use these two terms interchangeably. It is important to note, however, that they are different. Rational polynomials refer to any polynomial whose coefficient is a rational number. On the other hand, rational functions are a quotient of two polynomials. You can read more about rational functions here.
3.Least Squares Fitting
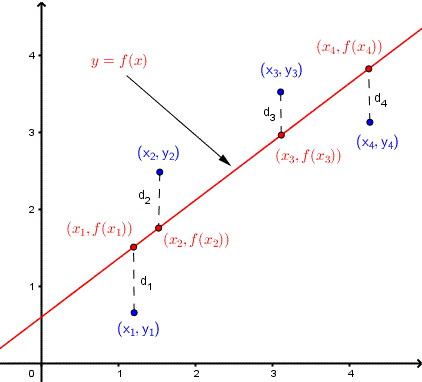
It is a method used to find the best fitting function for a particular set of data points. It works by minimizing the sum of squared residuals. At a particular x point, the difference between the y values of the data point and the fitted function is called the residual. For n data points, each one can be represented as \((x_i,y_i)\) where \(i = 1, 2, 3, ..., n\). The residual function at a specific point is \(y_i - f(x_i)\), where \(f(x)\) is the fitted function.
3-1. Linear Fitting
To find the line of best fit, we need to find \(f(x)\) such that the sum of all residuals is the smallest, or in other words, minimize \(\sum_{i=1}^{n} (y_i - f(x_i))^2\). To achieve this, we must set the derivative of the sum equal to zero. The plotted function can be represented as \(f(x) = a + bx\), where \(b\) is: $$b = \frac{\sum_{}y_i(x_i-\overline{x})} {\sum_{}x_i(x_i-\overline{x})} $$ and \(a\) is: $$a= \overline{y} - \overline{x}b$$ \( \overline{x}\) and \( \overline{y } \) represent the mean of all \(x \) and \(y \) data values respectively. Click here to learn more about how these equations were derived.
3-2. Polynomial Fitting
Similarly, one can follow this procedure with polynomial equations.